Model library
The Profitability, Financing, and Growth of the Firm
Goals, relationships, and measurement methods
Sven-Erik Johansson and Mikael Runsten
Studentlitteratur
2023, third edition
The book contains an accounting-based model for integrated analysis of a company’s profitability, financing and growth. The book is rather compact in form, with a focus on important concepts, accounting key ratios and their interrelations. A concrete example with increasing complexity is used to illustrate most of the ideas. In order to internalize the practical relevance of the book we strongly recommend that you read “real annual reports” in parallel with reading the book. In other words, read and try to make sense of what companies write about financial strategies, financial targets and which key ratios they choose to use when presenting performance and future ambitions.
Another method to make the concepts of the book come alive is to analyse companies that you care about. Calculate the key ratios and evaluate how sensitive the numbers are to alternative financial choices and outcomes. In order to simplify some of these tasks for you, we have made several simple (and sometimes more complex) Excel-models that you can download and experiment with. The headlines are meant to help you to see what the models try to capture.
Do not forget that a model can be very practical and helpful, but it cannot not draw conclusions for you. The wise conclusion you will have to draw yourself.
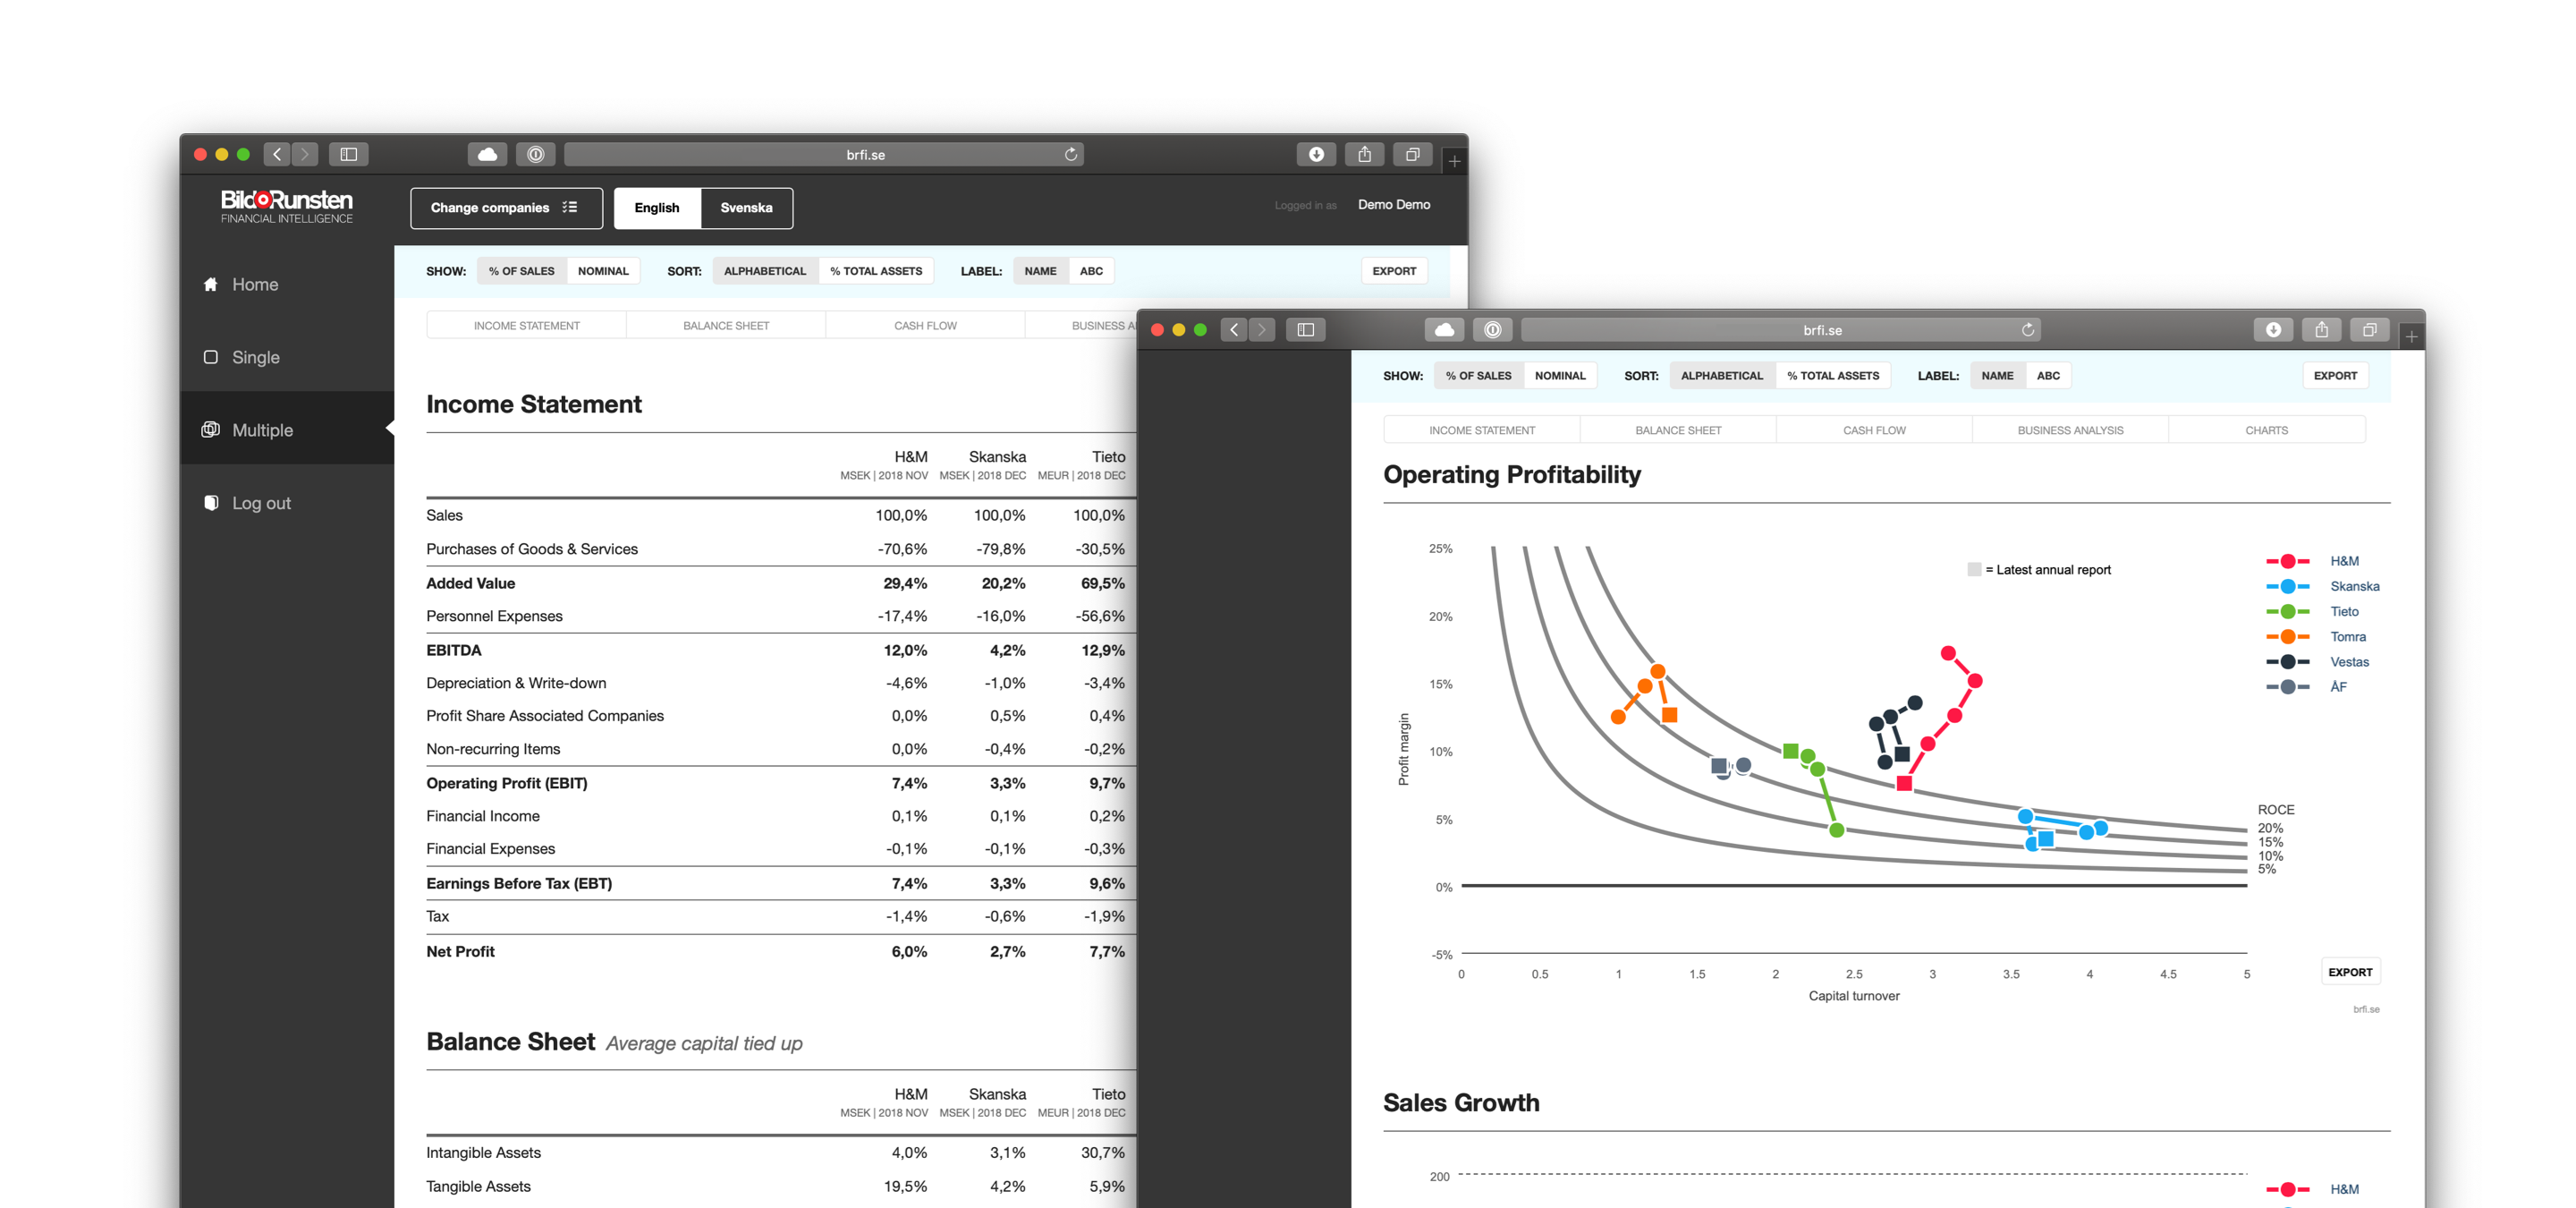
DuPont Curves
Models for graphical illustration of how return is made up of margin and asset turnover (see chapter 6 of the book).DuPont Tree
Models for decomposing and analysing the return of a company. As a first step the return is decomposed into the margin and the asset turnover. In a second step the components of the income statement and the balance sheet can be further analysed (see chapter 6 of the book).Relative reports
The provided models help you to create what we call relative reports. I.e. all the numbers in the income statement and the balance sheet are presented as a percentage of total revenues.Leverage relationship
The provided models support your calculations of the components in the leverage relationship. Read more in chapter 3 through 6 in the book.Growth relationship
The provided models support your understanding of the components in the growth relationship. Read more in chapter 7, 8 and 10 in the book.What-if
Here we provide models for evaluation of more complex business scenarios. The model called Futura is made for evaluating scenarios in line with discussion in chapter 8 of the book. The ND/EBITDA-Covenant-calculator builds on the discussion at the end of chapter 9.Valuation of companies and shares
Here we provide models that support the understanding of the valuation discussion in chapter 12 of the book. We suggest that you try them out on companies that you are interested in.Age calculator of fixed assets
A simple model that calculate the life and age of fixed assets based on footnote information. See chapter 13 in the book.Capitalize R&D
A model that supports the analysis of how income statement, balance sheet and important KPI:s would be affected if R&D expenditures were to be capitalized rather than expensed immediately. See chapter 13 in the book.Exercises
Solutions to many of the exercises in the book is providedSlides
Self-explanatory animated power point slides concerning several concepts described in the book


